Table of Contents
Debug PHP with xdebug
xdebug architecture
PHP Cli Debugging

The PHP extension php_xdebug.dll seamlessly installs code to provide interpreter control and communication between a client (Notepad++ with DBGp plugin installed in the IDE) and the PHP interpreter over port 9000. Effectively php_xdebug.dll includes a mini server to provide communication with a client.
Sequence of events
- Step A) Run Notepad++.
- Step B) Start Notepad++'s client (DBGp plugin) which opens socket 9000
- (listens on port 9000)
- Step C) Run script from Notepad++ (Executes PHP interpreter).
- Step D) Interpreter loads configuration file and loads extensions (php_xdebug.dll)
- Step E) XDebug establishes contact with client.
- Step F) Script is loaded and run.
- Step G) Script execution (debugging) is controlled by client.
Notes:
- Note 1: Debugging is initiated as soon as the interpreter loads XDebug.
- Note 2: If the script is initiated from an external source (for example, a batch file), XDebug determines if the script (F) is displayed in Notepad++. If not, it is downloaded.
- Note 3: If XDebug starts debugging a new page, that page is downloaded if not already displayed in Notepad++.
Web page Debugging

The second server is created using a PHP extension (php_xdebug.dll). It seamlessly installs code to provide communication between Apache and a client (Notepad++ with DBGpplugin installed) over port 9000. In addition, code is installed to monitor browser requests arriving on the standard Apache port 80.
Sequence of events(Assumes Uniform Server running (Apache server running))
- Step A) Start Notepad++.
- Step B) Notepad++'s client DBGp plugin opens socket 9000 (listens on port 9000)
- Step C) In a browser, enter address of PHP page to be debugged.
- Step D) Browser requests this page from Apache server over port 80
- Step E) Apache runs the PHP interpreter
- Step F) PHP interpreter runs its extensions including the XDebug module.
- Step G) XDebug module starts remote debugging.
- Step H) XDebug connects to debugging client over port 9000
- Step I) User uses client for debugging. Commands and data are sent over port 9000
- Step J) Client can instruct XDebug to execute one or more php statements. Your PHP code is executed; this may output data over http Port (80) to web browser.
- Step K) When all your PHP code has been executed, XDdebug disconnects from client.
- Step L) Followed by Apache closing connection to browser.
Config and run xdebug on windows
Check and download xdebug dll
- Step1: Run http://localhost/phpinfo.php to verify information of PHP version:
PHP Version 5.3.13
Compiler	MSVC9 (Visual C++ 2008)
Architecture	x86
Zend Extension Build	API220090626,TS,VC9
- Step2: Base on above information, we will download xdebug version for PHP5.3, VC9, TS. And x86(64bit) or x86(32bit)
- PHP 5.3 VC9 TS (64 bit):http://xdebug.org/files/php_xdebug-2.2.5-5.3-vc9-x86_64.dll
- PHP 5.3 VC9 TS (32 bit):http://xdebug.org/files/php_xdebug-2.2.5-5.3-vc9.dll
config and check
config
[php.ini]
[Xdebug]
zend_extension="c:\Program Files (x86)\PHP\ext\php_xdebug-2.2.5-5.3-vc9.dll"
xdebug.remote_enable=on
xdebug.remote_handler=dbgp
xdebug.remote_host=localhost
xdebug.remote_port=9000
check
- Check with PHP cli:
"c:\Program Files (x86)\PHP\php.exe" -m
Output:
[Zend Modules]
Xdebug
- check with phpinfo.php: http://localhost/phpinfo.php

Config tracing of function calls
Normal config:
xdebug.auto_trace=On
xdebug.trace_output_dir=c:\data
Custom config:
xdebug.collect_assignments: Default value 0, controls whether Xdebug should add variable assignments to function traces
xdebug-trace-gui
web config
- update php.ini for xdebug:
[Xdebug]
zend_extension="c:\Program Files (x86)\PHP\ext\php_xdebug-2.2.5-5.3-vc9.dll"
xdebug.auto_trace=On
xdebug.trace_format=1
xdebug.trace_output_dir=c:\logs
xdebug.show_mem_delta=On
xdebug.var_display_max_data=128
xdebug.collect_params=4
xdebug.collect_return=On
xdebug.trace_options=1
xdebug.trace_output_name= %H-%R-%r.trace
xdebug.profiler_output_name = %s.%t.profile
xdebug.profiler_output_dir=c:\logs
- config virtualhost for xdebug in apache config:
<VirtualHost *:80>
  DocumentRoot "D:/web/xdebug-trace-gui"
  ServerName xdebug.babies.vn
  ServerAlias xdebug.babies.vn
  DirectoryIndex index.php index.html index.htm
  <Directory D:/web/xdebug-trace-gui>
    Options Indexes FollowSymLinks MultiViews
    AllowOverride all
    Order Deny,Allow
    php_value 'xdebug.auto_trace' 'Off'
    php_value default_charset "utf-8"
    Allow from all
  </Directory>
  ErrorLog "logs/xdebug-error.log"
  CustomLog "logs/xdebug-access.log" common
</VirtualHost>
Use xdebug gui


log structure in xdebug
drupal example code run
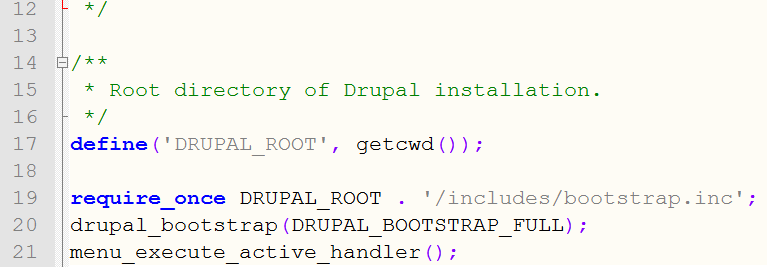
- index.php
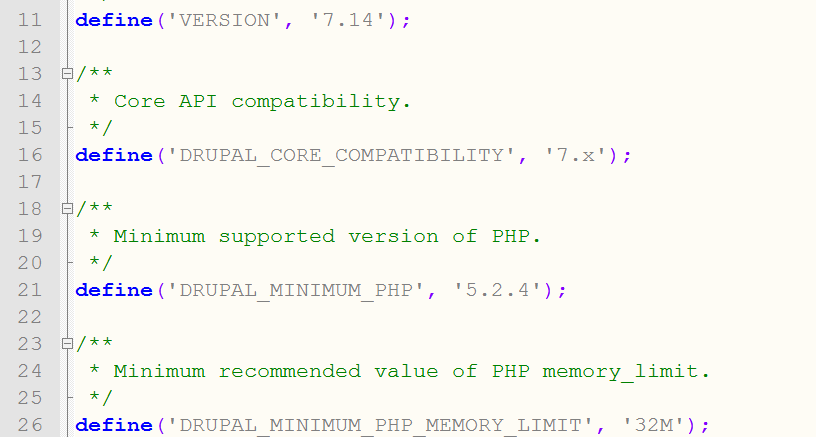
- bootstrap.php


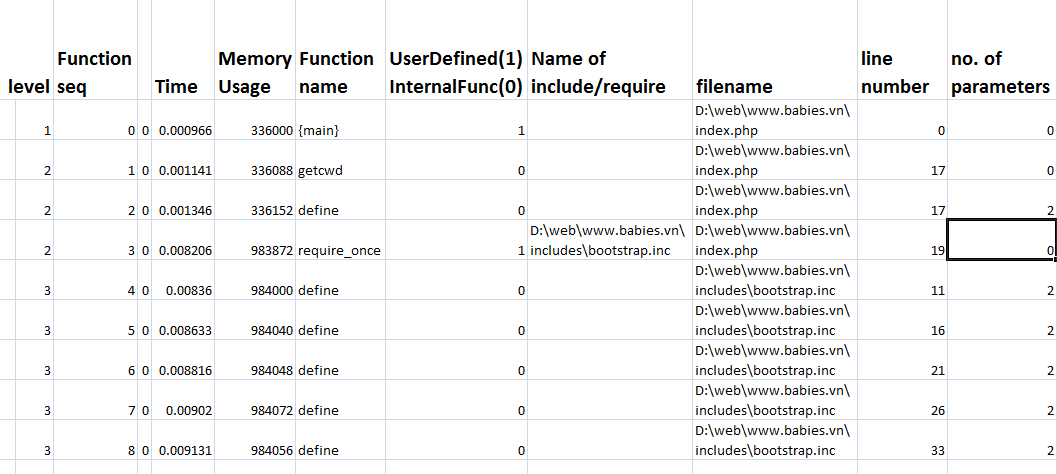
parser xdebug log of drupal
- Log
Version: 2.2.5 File format: 2 TRACE START [2014-06-07 07:14:44] 1 0 0 0.000966 336000 {main} 1 D:\web\www.babies.vn\index.php 0 0 2 1 0 0.001141 336088 getcwd 0 D:\web\www.babies.vn\index.php 17 0 2 1 1 0.001283 336120 2 2 0 0.001346 336152 define 0 D:\web\www.babies.vn\index.php 17 2 'DRUPAL_ROOT' 'D:\\web\\www.babies.vn' 2 2 1 0.001511 336184 2 3 0 0.008206 983872 require_once 1 D:\web\www.babies.vn\includes\bootstrap.inc D:\web\www.babies.vn\index.php 19 0 3 4 0 0.008360 984000 define 0 D:\web\www.babies.vn\includes\bootstrap.inc 11 2 'VERSION' '7.14' 3 4 1 0.008518 984016 3 5 0 0.008633 984040 define 0 D:\web\www.babies.vn\includes\bootstrap.inc 16 2 'DRUPAL_CORE_COMPATIBILITY' '7.x' 3 5 1 0.008774 984056 3 6 0 0.008816 984048 define 0 D:\web\www.babies.vn\includes\bootstrap.inc 21 2 'DRUPAL_MINIMUM_PHP' '5.2.4' 3 6 1 0.008953 984064 3 7 0 0.009020 984072 define 0 D:\web\www.babies.vn\includes\bootstrap.inc 26 2 'DRUPAL_MINIMUM_PHP_MEMORY_LIMIT' '32M' 3 7 1 0.009107 984088 3 8 0 0.009131 984056 define 0 D:\web\www.babies.vn\includes\bootstrap.inc 33 2 'CACHE_PERMANENT' 0 3 8 1 0.009209 984056 3 9 0 0.009232 984056 define 0 D:\web\www.babies.vn\includes\bootstrap.inc 38 2 'CACHE_TEMPORARY' -1 3 9 1 0.009309 984056 3 10 0 0.009332 984064 define 0 D:\web\www.babies.vn\includes\bootstrap.inc 63 2 'WATCHDOG_EMERGENCY' 0 3 10 1 0.009409 984064 3 11 0 0.009432 984056 define 0 D:\web\www.babies.vn\includes\bootstrap.inc 68 2 'WATCHDOG_ALERT' 1 3 11 1 0.009509 984056 3 12 0 0.009531 984064 define 0 D:\web\www.babies.vn\includes\bootstrap.inc 73 2 'WATCHDOG_CRITICAL' 2 3 12 1 0.009613 984064 3 13 0 0.009635 984056 define 0 D:\web\www.babies.vn\includes\bootstrap.inc 78 2 'WATCHDOG_ERROR' 3 3 13 1 0.009712 984056 3 14 0 0.009734 984064 define 0 D:\web\www.babies.vn\includes\bootstrap.inc 83 2 'WATCHDOG_WARNING' 4 3 14 1 0.009810 984064 3 15 0 0.009832 984056 define 0 D:\web\www.babies.vn\includes\bootstrap.inc 88 2 'WATCHDOG_NOTICE' 5 3 15 1 0.009908 984056 3 16 0 0.009930 984056 define 0 D:\web\www.babies.vn\includes\bootstrap.inc 93 2 'WATCHDOG_INFO' 6 3 16 1 0.010006 984056 3 17 0 0.010027 984056 define 0 D:\web\www.babies.vn\includes\bootstrap.inc 98 2 'WATCHDOG_DEBUG' 7 3 17 1 0.010104 984056 3 18 0 0.010125 984072 define 0 D:\web\www.babies.vn\includes\bootstrap.inc 107 2 'DRUPAL_BOOTSTRAP_CONFIGURATION' 0 3 18 1 0.010202 984072 3 19 0 0.010224 984072 define 0 D:\web\www.babies.vn\includes\bootstrap.inc 112 2 'DRUPAL_BOOTSTRAP_PAGE_CACHE' 1 3 19 1 0.010300 984072 3 20 0 0.010322 984072 define 0 D:\web\www.babies.vn\includes\bootstrap.inc 117 2 'DRUPAL_BOOTSTRAP_DATABASE' 2 3 20 1 0.010399 984072 3 21 0 0.010420 984072 define 0 D:\web\www.babies.vn\includes\bootstrap.inc 122 2 'DRUPAL_BOOTSTRAP_VARIABLES' 3 3 21 1 0.010497 984072 3 22 0 0.010520 984072 define 0 D:\web\www.babies.vn\includes\bootstrap.inc 127 2 'DRUPAL_BOOTSTRAP_SESSION' 4 3 22 1 0.010602 984072 3 23 0 0.010625 984072 define 0 D:\web\www.babies.vn\includes\bootstrap.inc 132 2 'DRUPAL_BOOTSTRAP_PAGE_HEADER' 5 3 23 1 0.010704 984072 3 24 0 0.010726 984072 define 0 D:\web\www.babies.vn\includes\bootstrap.inc 137 2 'DRUPAL_BOOTSTRAP_LANGUAGE' 6 3 24 1 0.010804 984072 3 25 0 0.010827 984064 define 0 D:\web\www.babies.vn\includes\bootstrap.inc 142 2 'DRUPAL_BOOTSTRAP_FULL' 7 3 25 1 0.010905 984064 3 26 0 0.010927 984064 define 0 D:\web\www.babies.vn\includes\bootstrap.inc 147 2 'DRUPAL_ANONYMOUS_RID' 1 3 26 1 0.011004 984064 - Description parameters in xdebug log

Get full log of 1 function with sub-functions
- For example function seq: 4599
Line 9548: 6 4599 0 1.037902 23012576 drupal_render
- We will get the end of function by search the line end of function:
6 4599 1
Result:
Line 15997: 6 4599 1 1.695917 23075144